Introduction
For a firm to be successful, it is necessary to understand client reviews. Monitoring reviews allows you to better understand customer’s preferences, likes, dislikes, and so on. The information obtained can then be used to improve customer satisfaction.
We’ll be working on a Brazilian E-commerce reviews dataset in this post, where we’ll do some statistical analysis on the text of the review, draw useful insights from our research, and then convert our results from Portuguese to English for quicker and safer comprehension.
Methodology
Importing and Installing Libraries
For our natural language processing, we must first import key libraries (such as pandas, numpy, and matplotlib) and NLTK tools.
# Importing needed libraries
import numpy as np
import pandas as pd
import seaborn as sns
import matplotlib.pyplot as plt
%matplotlib inline
from collections import Counter
from sklearn.feature_extraction.text import CountVectorizer
from sklearn.feature_extraction.text import TfidfVectorizer


# NLTK tools for text processing
import re, nltk
from nltk import word_tokenize
from nltk.corpus import stopwords
from wordcloud import WordCloud, STOPWORDS


from IPython.core.interactiveshell import InteractiveShell
InteractiveShell.ast_node_interactivity = 'all'
We’ll need to download Machine Translation API for our language translation. We initially received an error when using the original API, but we were fortunate to locate a workable version entitled ‘Google trans new’ a few days ago that effectively corrected the issue. For more information, go here.
pip install google_trans_new # Installing the translate API
import google_trans_new # Importing the package
print(google_trans_new.LANGUAGES) # Checking the list of languages that are supported
If you haven’t already done so, do it now because it will be used for our translation later. The list of languages handled by this translate API may be seen in the image above. For the time being, we are just concerned in Portuguese and English. Let’s have a look at an example:
# Running an example of google translate (from portuguese to english), Data Connection is required.from google_trans_new import google_translatortranslator = google_translator()translate_text = translator.translate('Excelente mochila, entrega super rápida.',lang_tgt='en',lang_src='pt' )print(translate_text)We can observe how our Portuguese content was translated and choose to convert to any of the API’s supported languages.
Data Preprocessing
After that, we’d read in our data to perform some early EDA (Explanatory Data Analysis) and dataset modifications.
# Reading in the reviews dataset
review_df = pd.read_csv('olist_order_reviews_dataset.csv')
review_df.head()
review_df.shape
review_df.isnull().sum()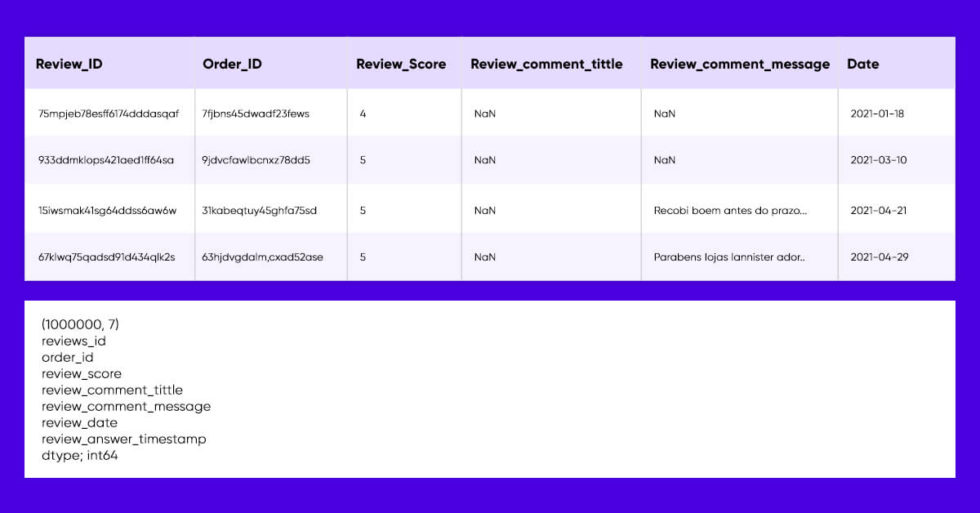
We’d be sure to drop those missing values and reset the index because the review dataset has a lot of NaN values in the text and titles of the review.
# seperating the reviews and the titles and dropping the missing rows seperately so that we don't have unequal shapes of rows.review_data_title = review_df['review_comment_title']review_data = review_df.drop(['review_comment_title'],axis=1) # Dropping NaN valuesreview_data = review_data.dropna()review_data_title = review_data_title.dropna() # Resetting the reviews index and visualizing the datareview_data = review_data.reset_index(drop=True)review_data.shapereview_data_title.shape
We need to implement some necessary preprocessing steps, which include converting the review sites data by removing stop words, using the fixed-length module to accept only mails, encrypting the text, and trying to make all the sayings lower case for consistency, just like the normal day-to-day NLP tasks. We’d have to eliminate the Portuguese punctuation marks in this scenario.
#Using wordcloud to visualize the comments
	unique_string=(" ").join(comments)
	wordcloud = WordCloud(width = 2000, height = 1000,background_color='white').generate(unique_string)
	plt.figure(figsize=(20,12))
	plt.imshow(wordcloud, interpolation='bilinear')
	plt.axis("off")
	plt.show()
The Wordcloud above reveals the most common words in Portuguese; but, if you don’t speak Portuguese, this information is useless, thus we must translate these words into English. Countvectorizer was employed at this point to extract the most significant Unigrams (one word), Bigrams (two words), and Trigrams (three words) (three words). The codes and pictures below display the trigrams as well as their English equivalents. Replace ngram range =(1,1) and (2,2) to get the unigrams and bigrams, accordingly.
# Using CountVectorizer to get the most important trigramsco = CountVectorizer(ngram_range=(3,3))counts = co.fit_transform(comments)important_trigrams = pd.DataFrame(counts.sum(axis=0),columns=co.get_feature_names()).T.sort_values(0,ascending=False).head(50)
# Next, we reset the index, rename the columns and apply the translate module to get the english translations important_trigrams=important_trigrams.reset_index()important_trigrams.rename(columns={'index':'trigrams',0:'frequency'},inplace=True)
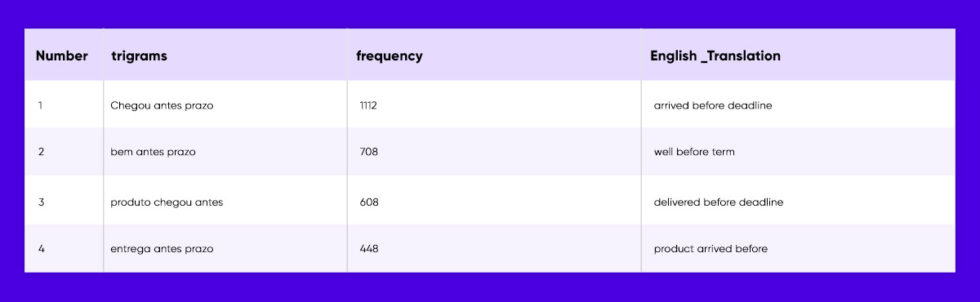
We can confidently gather from unigrams, bigrams, and trigrams obtained that the majority of consumers were satisfied with the delivery service, and others were satisfied with the overall quality.
The review titles column was likewise preprocessed in the same way, and Wordcloud has been used to display the titles.
# Processing the reviews titles data
	comments_titles = []
	stop_words = set(stopwords.words('portuguese'))

	for words in review_data_title:
	    only_letters = re.sub("[^a-zA-Z]", " ",words)
	    tokens = nltk.word_tokenize(only_letters) #tokenize the sentences
	    lower_case = [l.lower() for l in tokens] #convert all letters to lower case
	    filtered_result = list(filter(lambda l: l not in stop_words, lower_case)) #Remove stopwords from the comments

	    comments_titles.append(' '.join(filtered_result))

	    #Using wordcloud to visualize the comments titles
	unique_string=(" ").join(comments_titles)
	wordcloud = WordCloud(width = 2000, height = 1000,background_color='white').generate(unique_string)
	plt.figure(figsize=(20,12))
	plt.imshow(wordcloud, interpolation='bilinear')
	plt.axis("off")
	plt.show()()important_trigrams.rename(columns={'index':'trigrams',0:'frequency'},inplace=True)
co = CountVectorizer(ngram_range=(3,3))counts = co.fit_transform(comments_titles)important_trigrams_title = pd.DataFrame(counts.sum(axis=0),columns=co.get_feature_names()).T.sort_values(0,ascending=False).head(50) important_trigrams_title=important_trigrams_title.reset_index()important_trigrams_title.rename(columns={'index':'trigrams_title',0:'frequency'},inplace=True) important_trigrams_title['english_translation'] = important_trigrams_title['trigrams_title'].apply(translator.translate)important_trigrams_title
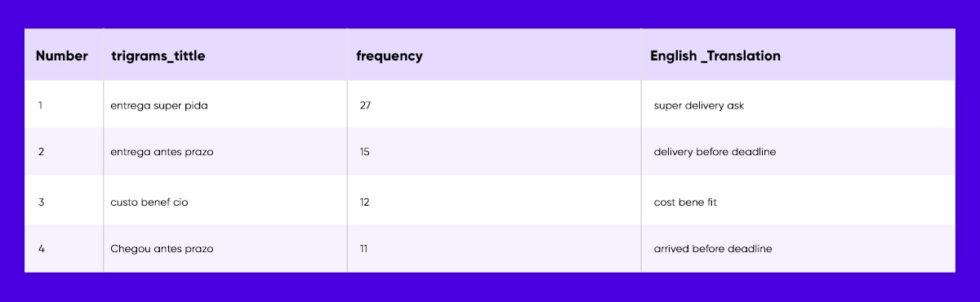
We were able to better understand the unpleasant comments of disappointed consumers by performing comparable operations on the reviews title column. The following are some of the comments: receiving an unfinished delivery, obtaining incorrect/defective products, not receiving purchased goods, delivery delays, and low quality of provided goods. These are the most common complaints from dissatisfied consumers, however other customers have expressed great levels of happiness.
We need to build a counting graph presenting these figures to evaluate the relationship between consumers who supplied low/high review scores and those who gave reviews.
Contact our experts at X-Byte Enterprise Crawling for further queries.
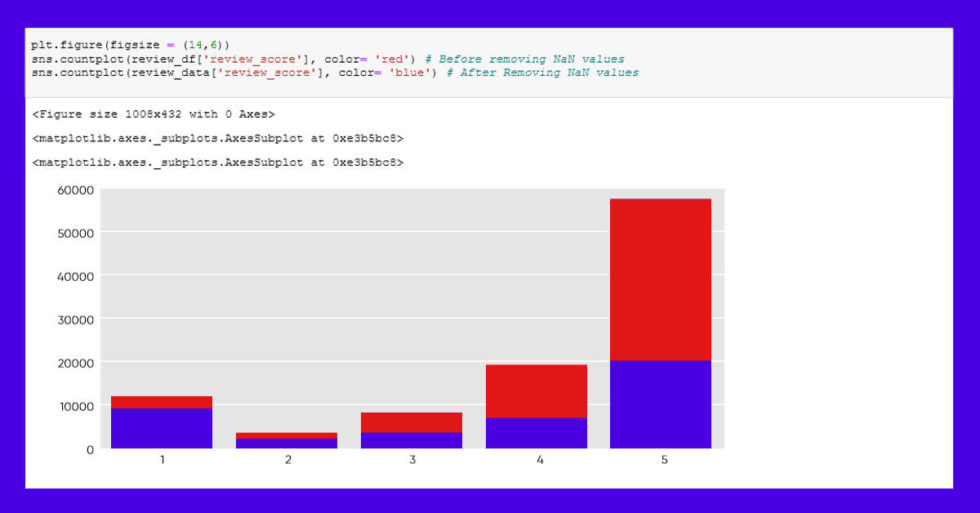
We can see that 36% of 5-star reviewers left reviews, but 79 percent of 1-star reviewers left reviews, indicating that customers are likely to leave evaluations when they are dissatisfied.
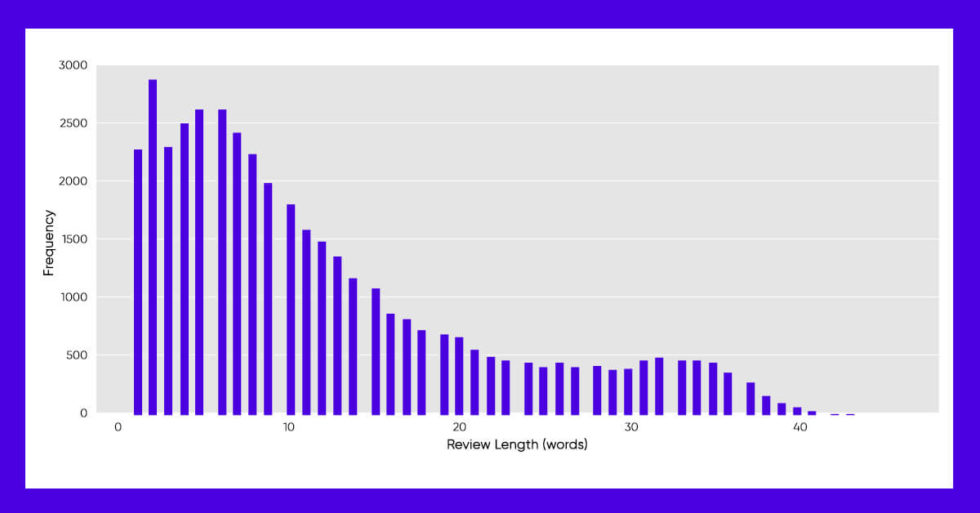
Take a look at the average number of words each review as well.
# Getting the number of words by splitting them by a space
	words_per_review = review_data.review_comment_message.apply(lambda x: len(x.split(" ")))
	words_per_review.hist(bins = 100)
	plt.xlabel('Review Length (words)')
	plt.ylabel('Frequency')
	plt.show()
Conclusion
So far, we’ve been able to analyze client content such as text and see some dissatisfied remarks. Now, it is up to the data scientist or analyst to choose the most effective methods for resolving these issues.
We are confident that at the end of this blog, you’ll be able to perform basic textual visualization and translate text languages to your favorite language using the Google Translate API. There are also plenty of other ideas that can be used with this dataset, like text classification and topic detection.
 ✯ Alpesh Khunt ✯