
Understanding the transition of clean energy would need a range of social movements, which would include however are not being restricted to replacing inner combustion vehicles having electric counterparts, making net-zero carbon buildings, as well as replacing fossil fuel plants having wind or solar farms. This is often hard to understand exactly where and how the acceptance of clean energy happens as the social shifts are happening in real-time as well as tend to get de-centralized. So, it is unusual to get an updated database on the clean energy campaigns or initiatives, having easy-to-read data, which can keep us well informed.
Certainly, amongst the greatest challenges related to clean energy transitions is the huge amount of new data produced when the transition takes place. Unfortunately, most of the data is distributed across various locations and websites, as well as is stored in various formats (excel sheets, pdf files, web pages, etc.) which makes the analysis extremely time-intensive. Whereas some analyses and datasets of a clean transition are regularly published—e.g., on the monthly basis—they get published annually more often.
At X-Byte Enterprise Crawling, we are constantly working on tools for collecting and analyzing present data on clean energy transitions in real-time. All these tools assist us in providing evidence-based policy advisory, network building, communications, etc.
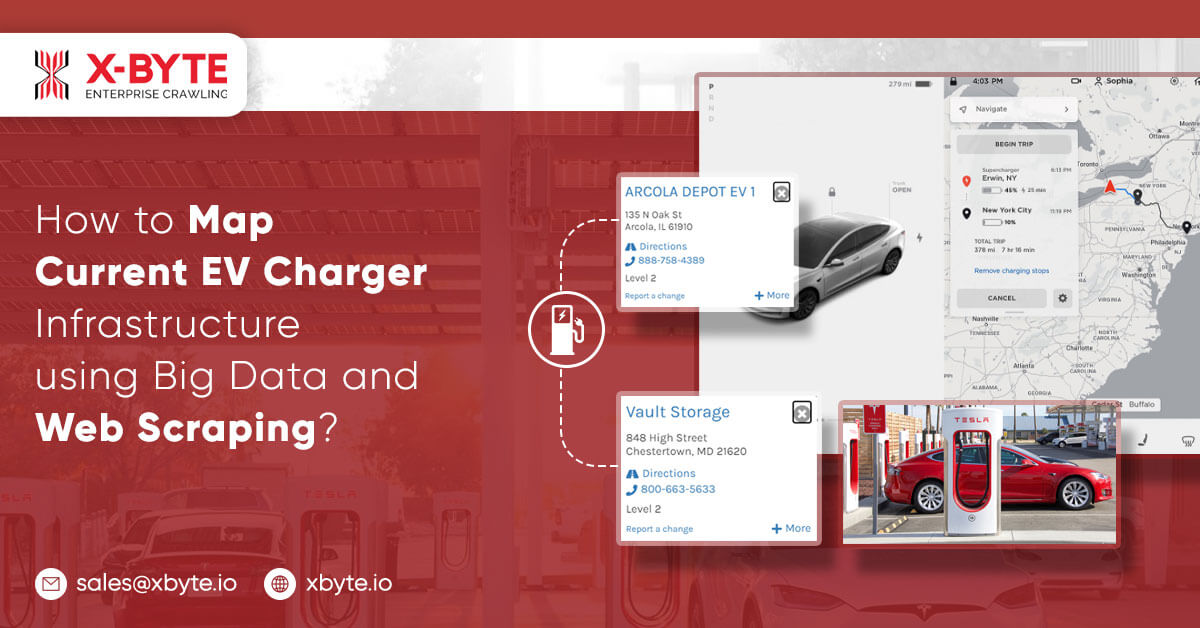
Among the tools that we are working with recognizes the location of the present EV charging infrastructure in the country. EVs would be the main part of the clean energy transition. Worldwide, the transportation sector is accountable for about 40% of the energy consumption as well as 28% of the total energy-associated CO2 emissions. During 2019, the transportation sector accounted for about 18% of the CO2 emissions within ASEAN. Therefore, moving towards electric vehicles together with switching renewable energy resources will considerably reduce carbon emissions.
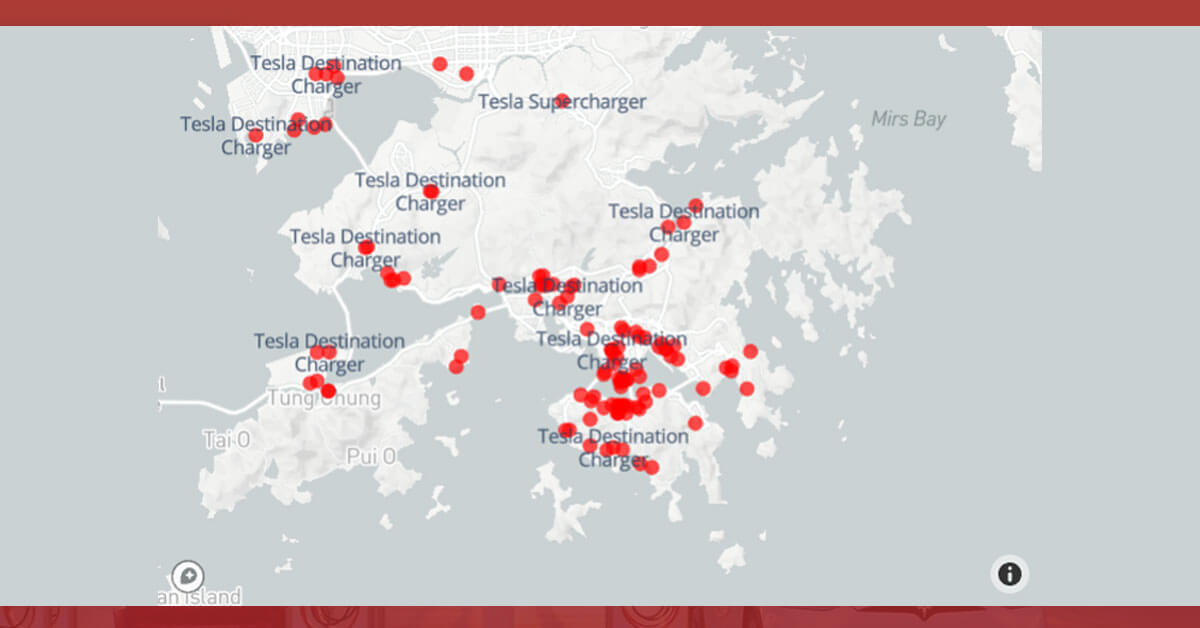
One technique of assessing the universality of electric vehicles is mapping how many charging ports are accessible, where they are located, as well as which companies are supply chargers. Even a glance at a map could provide us insights into how easy that is to have an EV within the country or city in question.
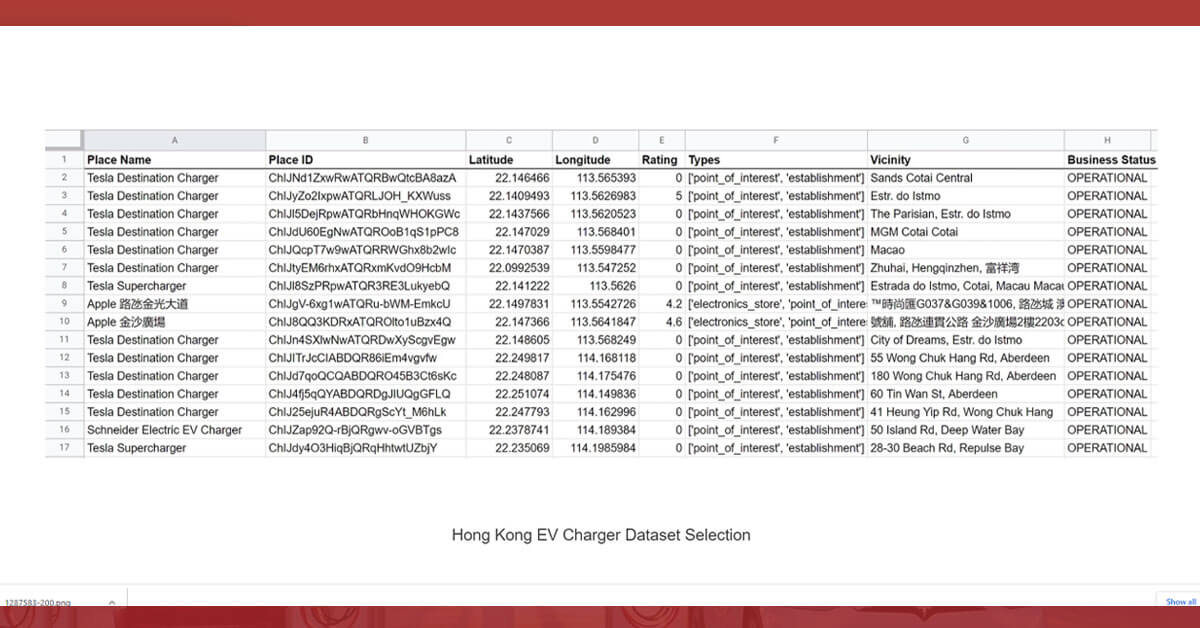
With Python programming codes, we can extract data from EV chargers given in Google Maps as well as save them in the excel datasets.
“We all understand how to get the nearby EV charger. You just need to open the phone and type “EV charger” in Google Maps, as well as press search and boom! Now, you understand where the nearby 30 charging stations are.
Therefore, in principle, you can:
(1) Run the search
(2) Write all the applicable search results
(3) Walk 10 km distance in one route
(4) as well as repeat
As it is an effective way of hitting your everyday step count, this is not convincing. Luckily, there is one way of writing code, which persuades Google Maps, which you are actually in long walks as well as car chargers.
The primary case study offered concentrates on Hong Kong and we have collected the listing of public EV chargers within Hong Kong as well as utilizing Python, routinely saved the dataset in a Google Sheet. The Python code could be re-run any time for keeping the datasets updated.

This tool is the initial step for using data and developing a complete picture of the EV infrastructure. Using this Hong Kong case study, it’s easy to continue analysis through writing code, which extracts data from the Hong Kong Transport Department for a listing of EV models presently approved for a road. Then, we can utilize the listing to track ‘total EV car companies in Hong Kong’, visit every company’s page, as well as pull applicable EV data from their website (car sales, every EV model sold, EV charger maps, etc.).
Different web scraping tools may also apply to different facets of clean energy transition like energy efficiency perspective, renewable energy development, as well as policy status. Whereas more exploration requires to get done, it might be possible to do everyday scrapes about renewable investment pipeline sites, whereas also utilizing code for analyzing and mapping grid transformation. To do energy efficiency, map scraping might be able to provide us more precise data on creating areas as well as building competence in various urban zones or areas. To sum up, the ability to use Python for collecting data as well as analysis could open the doors for a quick and more controlling analysis of energy transition.
